"Most of our ancestors were not perfect ladies or gentlemen, most of them weren't even mammals" - Robert Anton Wilson
So this might be a bit of a experiment I am looking to take a machine learning algorithm and research how has developed and changed society. My hope is to write for a non technical reader in order to highlight interesting algorithms and there affects on society.
Today I am looking at Biclustering or sometimes called multi-clustering. Biclustering is stunning when you understand how much it has benefited fields such as genomics and bioinformatics.
Tutorials for Biclustering:
Why reinvent the wheel Scikrit learn show you the code for creating a biclustering project along with suitable graphs to present the data. I think the issue though is not to show code but to explain it in the most simplified manner.
A demo of the Spectral Biclustering algorithm — scikit-learn 1.0.2 documentation
The main single line of code that creates a biclustering below. Like all scikrit learning models you then run a fit command on the object.
CODE:
model = SpectralBiclustering(n_clusters=n_clusters, method="log", random_state=0) model.fit(data)
A description of how you can modify the above code is found here.
sklearn.cluster.SpectralBiclustering — scikit-learn 1.0.2 documentation
If you have any questions on how to implement one yourself the above links are a good start.
Biclustering Oversimplified:
The Biclustering Algorithm is a unsupervised clustering algorithm (in simple terms it takes unlabelled data and groups them into groups).
Biclustering takes data and splits it out into columns and rows. It does this by shuffling the data and picking the shuffles that reduce a error value and then repeating the process until the shuffling does not reduce the error. Within Bicluustering the error being reduced is mutual information meaning a row or column shares the maximum amount of "similarity" with the column or row next door. This overtime pushes the shuffled data in groups or clusters that maximise this similarity.
It is reasonable to ask how does one quantify something like "similarity"; well it is typically in statistics called a entropy calculation or an information gain calculation. This is the same basic principle that a variety of decision tree's are built. The full name for this calculation is Kullback–Leibler divergence.
In both decision trees and Biclustering the method is to present two different ways of mixing up the data and recursively choose the option that demonstrates the maximum information gain. This follows because each time you pick a choice producing the max information gain it results in purer outcomes; within biclustering the purity is that the rows and columns next to each other are more similar while within decision trees the split chosen maximises purity in sense that the target classification trying to be optimised is purer.
We can define purity in this sense that after the algorithm iterates the target is more similar and more alike each other sharing more traits and being closer together in values. i.e. as per information theory if we where to randomly look at any two side by side variables the likelihood of finding them to be same would increase with each step of the algorithm.
The below code is the decision tree code I built to calculate entropy. Recursively the algorithm will take the data shuffle it and cycle through all the shuffles calculate the entropy then pick the option that minimises entropy and thereby maximises information gain. Keep repeating this process till you don't find any shifts that reduce entropy.
CODE:
def entropy(self,reader,filters=[],nots=[]):
collect={}
a=0
for row in reader:
if self.filters(row,filterlist=filters,nots=nots)==True:
a+=1
if row[self.forecast] in collect:
collect[row[self.forecast]]+=1
else:
collect[row[self.forecast]]=1
if len(collect) >0:
b=0
for c in collect:
ratio=collect[c]/a
b+=(-1 * ratio) * math.log(ratio)
return b
else:
return 1
PS its kind of atrocious code, I have spent more time thinking about neural networks and so isn't optimised, by all means steal my code but trust me you can do better. The above supplied just to show the general principles involved with the algorithm. But hopefully that will give you the big picture on how the algorithm works. The main point is this piece of maths.
b+=(-1 * ratio) * math.log(ratio)
So that is Biclustering massively oversimplified more complex maths is available on Wikipedia. It shuffles and calculates a value and while it is not guaranteed to optimise down to the most perfect solution ever it is efficient at finding groups within the data and unlike other clustering methods like K means clustering it doesn't suffer from inability to use lots of variables.
When using biclustering you might use the rows representing say genes (or other 0-1 value representing gene being absent or presence respectably) and the rows representing the thing being clustered such as presence of cancer etc. This will result in a checkerboard as the algorithm groups similar traits holding similar outcomes.
Code Examples:

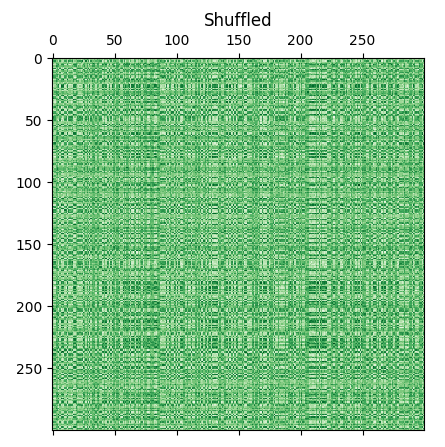
The picture below shows the function the far right shows that it isn't a trick that a intertional checker board does exist in the data. The middle shows the data as imported i.e. the intended groupings and the board on the left shows the model that was found. It can be seen that Biclustering will not magically find the original sort but you can count two dark green within the sort showing that it is close enough.
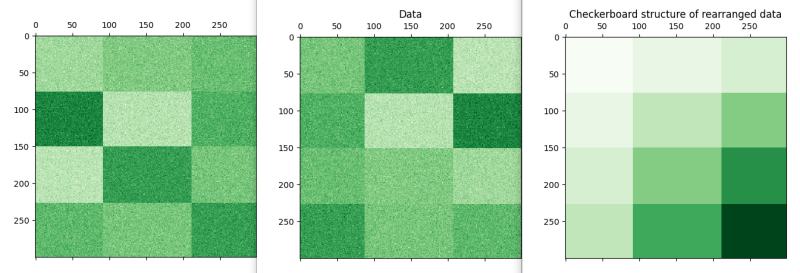
Therefore the conclusion should be that Biclustering allows you to take dirty data and arrange it into more efficient manner grouped together with similar data. As you can say it isn't perfect but the process is more designed to find grouping where no knowledge of how to group them exists. If you had pre labelled data categorisation would be more appropriate to clustering techniques.
What is it good for?
This can be interesting as when grouped in this manner we can see which groups correspond with each other and has especially useful applications when used in bioinformatics and genomics as when you have a large population of genetic samples you could take a disease and cluster so to identify which clusters demonstrate the trait or disease and look to see what other genetic characteristic's co-exist with the disease.
Multiple papers exploring a variety of different configurations for Biclustering are out there with regard to using Biclustering to identify groups with genes. The algorithm is efficient at this task because individual genes may not correspond to the disease or issue being investigated on there own but do in combination. It should be noted that Biclustering is not overly finicky about this and will ignore and not group where similarity is less to do with individual genes. In short biclustering does not sacrifice the big picture for the small picture.
Biclustering has been proposed as a method of providing individualised medicine. The high level idea is that modern medicine is systematised and based on "empirical medicine" where a doctor prescribes the best treatment based on knowledge from across lots of patients. This is effective for traditional methods but when we discuss diseases like cancer where the underlying mechanisms is a complex interplay between genes and environment. It is proposed that machine learning methods such as biclustering can be used to group patients into groups so to subdivide cancer treatments to greater specificity for the likely cause of the cancer.
If you want more details you can read more on this paper which proposes a bayesian method for biclustering for patient stratification (again grouping patients but based on probability of being amenable to the treatment) khakabimamaghani.pdf (stanford.edu).
Specifically this approach has been applied to cancer to identify cancer type from genetic samples of patients and group them accordingly. Typically in this approach the rows represent different genes and the columns represent diseases.
Though other uses such as natural language processing could be used where the columns represents the existence of words and or tags within a canon and the rows represent what genres it is. You could then group them using biclustering and look for similarities in themes, language and story within language.
In fact one paper took this further and proposed that biclustering itself could be seen as a theoretical model of joining two diverse sets of data at the level of informational theory itself. Which while being a little too theoretical for my taste is nonetheless very cool sounding.
The paper can be fond here Information-theoretic co-clustering | Proceedings of the ninth ACM SIGKDD international conference on Knowledge discovery and data mining
It is also NP complete. Which in order to mentioning the words polynominal time (with the attendant horror such a word evokes) I will just say it will solve a given problem eventually; which I think we will all agree is pretty useful though before dinner would be preferable. You can see the research paper in the further research section. P
History:
Biclustering was originally introduced by J. A. Hartigan in 1972. It was not till 2000 though a algorithm was created that fit this requirement. The paper on this is here and is considered one of the most important papers on bioinformatics available here: bicluster3.dvi (princeton.edu), The paper is lauded on Wikipedia as one of the most important papers in the history of bioinformatics.
Biclustering is something many people will never had heard of but it has shaped the world in unique ways. Genomics and genetic modification may not exist without this computer algorithm. Grouping genes with end outcomes and diseases may sound like a simple thing but with potentially millions of rows and millions of genes it would be either impossible or close to without biclustering.
Benefits of Biclustering:
Advantages over other clustering methods
-Does not need to pick a number of clusters to split the final data.
-Adding more variables adds more time to calculation but this is not a exponential calculation
-is not as liable to the curse of dimensionality when compared to K-means clustering.
-Adding more dimensions does not impose a large exponential increase to calculations any new variable is only adding another entropy calculation of the type below.
-Biclustering can be split up into several simple calculations for processing on a GPU or done in parallel on multiple CPU. The below is the key calculation.
-Can work with sparse data (especially if using spectral methods, see below). Sparse data means that the matrix may
CODE:
b+=(-1 * ratio) * math.log(ratio)
Problems with Biclustering
-assumes that a "checkerboard" type of similarity exists in the data will be less effective if the data is about distance between groupings in a multi dimensional N space. In which case use K means clustering or another clustering method.
-some further analysis of clusters after creation maybe needed to quantify the X factor that unites the sets as being more alike.
-needs lots of labelled data and I don't think would work if you said didn't know whether a individual was a man or a woman you couldnt put 0.5 in both and while the algorithm is purported to have some resistance to dirty or noisy data a lot of organisations may not have databases on every factor of there customers in the same way as may use large DNA databases looking for cancer markers.
Adding Back in the complexity
The above "simple method" represents only one method from the two methods that where originally proposed for biclustering. I am also trying to be light on the maths for non technical persons. if you enjoyed this article perhaps you can consider some of the below to add back in the complexity.
I am admittedly only talking about Biclustering is a generalised platonic form; if you went on Wikepedia here Biclustering - Wikipedia; you would find a vast carnival of different implementations of the algorithm discussed. The one that I find most interesting is the evolutionary variants that include aspects of genetic algorithms into the method and are capable of finding multiple patterns to very high precisions.
Even within the Scikrit learn library there is multiple methods called Bistochastic, scale and log. The different methods for optimisers perform better on different data; so the log method performs better on sparse data. Bistochastic unfortunately has little to do with biscuits and more about introducing stochastic (think random) into the process and is the standard algorithm described above.
reference for methods and documentation on the scikrit learn implementation is here sklearn.cluster.SpectralBiclustering — scikit-learn 1.0.2 documentation
You could research Spectral clustering. Spectral clustering avoids the curse of dimensionality by adding a pre-clustering step to your algorithm:
- Reduce the dimensionality of feature data by using PCA.
- Project all data points into the lower-dimensional subspace.
- Cluster the data in this subspace by using your chosen algorithm.
Different rows or columns can be differently weighted (i.e. you can create a weighting to columns or rows but not both). This lets you focus so it becomes more important to cluster certain values. This is the method chosen for the discussed method for identifying what group of cancers a individual belongs to.
You can see why I might say I have oversimplified Biclustering but hopefully you might now add in the other stuff.
Note the code for the code example was taken from Scikrit learning website and all credit goes to the original programmer.
Further research:
1. The Maximum Edge Biclique Problem is NP-Complete
The Maximum Edge Biclique Problem is NP-Complete — Tilburg University Research Portal
2. Information-theoretic co-clustering
3. - Co-clustering documents and words using bipartite spectral graph partitioning
4.
CiteSeerX — Two-mode clustering methods: a structured overview (psu.edu)
5. Microarray Analysis to Classify Genes and Phenotypes by Yuval Kluger, Ronen Basri, Joseph T. Chang, Mark Gerstein
6 Biclustering of Expression data, by Yizong Cheng and George M Church
bicluster3.dvi (princeton.edu)
7.
Add comment
Comments